×


_extra_large.jpeg)


3 Steps to Effective Lubrication Management
For many, the first stage in establishing an effective oil analysis or lubrication program is attending a training course to understand what best practice really means. Unfortunately, some leave the course just as confused as when they started, overburdened by the amount of information to comprehend, digest and apply in order to become a world-class organization. The phrase foremost in their minds as they leave the classroom on the final day of training is, “Where do we go from here?”
What’s required is an individualized roadmap or blue print for the months and years ahead. A document that acts as a starting baseline from which current strengths, weaknesses, opportunities and threats can be assessed, providing a clear direction for short, medium and long-term goals is called a Lubrication and Oil Analysis Survey.
What is Lubrication Management?
Many people define a lubrication survey as a complete list of all oil and grease lubricated equipment with an appropriate product recommendation listed next to each component. While there can be no doubt that making sure the right product is selected for the right application is critical, there is so much more to good lubrication than product selection.
In the past few years, there has been a growing trend in establishing lubrication management programs, and these organizations have been reaping the rewards.
 |
|
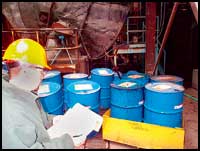
Assessing fluid storage and handling is a vital component of an effective lubrication survey.
|
The lubrication management concept takes a holistic approach to lubrication. In this approach, lubricants are considered not as consumables to be purchased at the lowest price, but as an asset to be managed and nurtured. This nurturing process starts the day the lubricant arrives onsite, and ends the day the oil is drained from the component and disposed of appropriately. In doing so, the key areas to consider include:
- Lube standards, consolidation and procurement,
- Lube storage and handling,
- Oil sampling techniques,
- Contamination control,
- Training, skill development and certification,
- Lubricant analysis,
- Lubrication/relubrication standards and best practices,
- Program management,
- Procedures and guidelines,
- Program goals and metrics,
- Safety and disposal guidelines and best practices, and
- Continuous improvement.
For a lubrication management program to be effective, all of these areas must be assessed, and improvements made to bring current practices in line with industry best practices if necessary.
The lubrication and oil analysis survey process is an incremental approach to assessing the strengths and weaknesses of a plant lubrication program and charts a course for ongoing, sustained improvement.
Step 1: Program Overview and the Spider Diagram
It is difficult to compile an overview of the relative strengths and weaknesses of a lubrication program without a full understanding of all areas involved in a plant lubrication program. However, such an overview is a vital first-step in mapping out where short and long-term goals should be focused. What is required is a means of quantifying each key area, while at the same time, providing an overview of the lubrication program as a whole.
To achieve these objectives, a spider diagram is used to illustrate such strengths and weaknesses. The spider diagram, named because of its resemblance to a spider’s web, is a multidimensional analysis tool that offers a visual overview of where strengths and weaknesses lie, with a more detailed analysis of each problem area outlined in the survey report.
 |
|
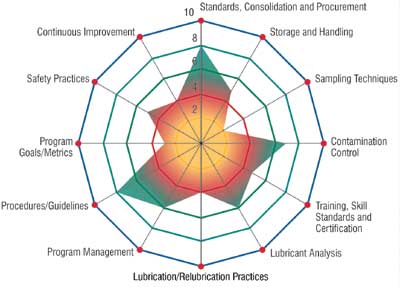
Figure 1. Spider Diagram
|
During the lubrication survey process, the plant is audited with each key area of lubrication excellence rated on a scale of 1 to 10. The data is then plotted on a spider diagram as shown in Figure 1. In this approach, scores ranging from 1 to 4 require immediate improvement, scores ranging from 4 to 7 represent average conformance to industry best practices, while scores greater than 7 represent good compliance with industry standards.
Overall, the more complete the spider web, the better adherence to best practices, with blank areas indicating a need for improvement. The goal for continued improvement should be for the web to expand each year, with annual audits conducted to measure the effects of continued improvement. These improvements should continue until all facets of lubrication management score in the 7-and-above range.
Step 2: Reliability Cost Assessment
While the spider diagram offers a succinct way of evaluating the strengths and weaknesses of a lubrication program in relation to industry best practices, it fails to account for those factors that have the biggest impact on equipment maintenance costs at the plant level.
For example, an assessment of a plant lubrication management program may indicate a weakness in the area of lubricant analysis. However, if most failures are a result of inadequate contamination control, it doesn’t make sense to revamp the oil analysis program, without first improving fluid cleanliness through improved breathers, seals and oil filtration.
While logic may suggest improving all areas of weakness, fiscal restraints including budgets and manpower issues require a step-wise approach, which focuses on the most common and costly problems first. This approach is often referred to as the Pareto principle.
To achieve this kind of specificity, it is important to look beyond a simple snapshot of the plant as a whole, and break the audit process into component and/or production areas and assess historical failures using a Failure Modes Effects and Criticality Approach (FMECA). The FMECA approach assesses each component or group of components and provides a breakdown of which factors are the most important areas to target in order to improve reliability and hence reduce overall maintenance cost.
In conjunction with this FMECA approach, an analysis of the financial implications of poor equipment reliability for each component type should be made, including raw repair costs, as well as other factors including lost production costs. An example of this type of analysis is shown in Table 1. Based on the data in Table 1, initial resources should be focused on reducing moisture contamination in the gearboxes in area 2. Even though these gearboxes have the lowest failure cost per event, their relatively high failure rate means that the most effective cost reduction strategy is to control moisture levels in these gearboxes.
Reliability cost assessment is a critical part of the whole survey process because it allows recommended improvements to be prioritized based on their effect on equipment maintenance costs.
Step 3: Oil Analysis Program Design
Oil analysis plays a vital role in lubrication management. While it is true that oil analysis is important in providing early warning signs of impending failures, its role in a comprehensive lubrication management program is far more broad reaching and significant.
For example, the lubrication survey may indicate the need for improved contamination control. But how are problems identified? How are corrective measures to improve fluid cleanliness monitored? The answer is regular, routine oil analysis, whether performed onsite, offsite or a combination of both.
Setting-up oil analysis Key Performance Indicators (KPIs) is an excellent place to start. For example, assessing ISO fluid cleanliness, either as a plant-wide composite score, or more frequently based on component type allows a measure of current levels of fluid cleanliness and annual improvements to be gauged. The goal is to reduce the KPI, in this case the composite ISO fluid cleanliness rating, on an annual basis until no further improvements can be made. Other oil analysis KPIs include:
- Composite moisture levels,
- The number of exception samples which show high wear rates, and
- The conformance of samples results to new oil specifications.
In addition to oil analysis KPIs, data from other condition-monitoring technologies such as vibration analysis, thermography and ultrasonics can be used for a multifaceted, multidimensional feedback mechanism. In this scenario, oil analysis and other condition-monitoring tools are simply yardsticks by which lubrication management success or failure is measured.
 |
|
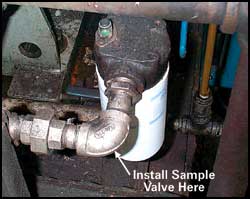
Sample point location is an important consideration when implementing an oil analysis program.
|
If oil analysis is to be used as a metric for lubrication management, it is important that the lubricant analysis program is designed with this goal in mind. As such, the initial lubrication audit should review each critical component and provide feedback on the key areas of concern. These include:
- Sample point location,
- Sampling hardware,
- Sampling procedures,
- Sampling frequency,
- Oil analysis test slate selection, and
- Setting appropriate alarms and limits.
Although this approach may appear a daunting proposition, it is a vital step to ensuring improvements in other areas of lubrication management can be assessed and evaluated on an ongoing basis.
Having taught courses on oil analysis and lubrication management best practices for a number of years, it always amazes me the relative proportion of course participants who leave the classroom with big plans to revitalize an ailing lubrication program to those who, one to two years down the road, have actually made significant changes.
While many realize that improvements in areas such as lube storage, contamination control and oil analysis can significantly improve equipment reliability and help overall maintenance costs, they lack focus simply because defining a starting point is difficult. It is also slowed by the daunting tasks necessary for improvement, which are perceived as impossible.
However, the simple task of conducting a comprehensive lubrication survey may be all it takes to get an organization on the path of lubrication excellence, and will provide a roadmap for continued success. Learn more about how Noria can help with developing your lubrication or oil analysis program.
