
.jpeg)


The very best oil analysis programs incorporate some degree of on-site analysis. For most plants, mills, and mines, particle monitoring is the most productive on-site oil analysis activity available.
Studies show that particle contamination is responsible for up to 80% of lubrication-related machinery failures. Hard particles can enter the system through seals, breathers, new oil changes, and top-offs. They can also be generated within the system from component wear. These particles can abrade, fatigue, and erode component surfaces - robbing them of precious life.
Because particles cause so many problems, they should be monitored regularly and controlled by filtering the oil or changing it as required. Particles are generated when a machine fails, and monitoring for increased generation of wear debris alerts the technician of an impending failure.
The simple patch test enables the technician to quickly identify abnormal levels of contamination and wear debris so that corrective actions can be scheduled accordingly. While several excellent automatic particle-monitoring devices (particle counters and wear debris meters) are available, low-cost patch microscopy allows on-site particle monitoring without spending a great deal of money.
The patch test can help maintenance personnel determine if on-site particle monitoring suits their needs. It can also provide them with experience and information that will help them determine if a more sophisticated particle-monitoring device is needed and, if so, which device best suits their needs.
The procedure for performing low-cost patch microscopy is explained below.
Analyzing Debris on the Patch
After the patch has been prepared, a number of things can be determined by visually examining the debris collected on the patch.
First, by using the 100 X magnification microscope, a comparison may be made with a catalog of standard patches, which can be obtained from numerous sources. The appropriate ISO Cleanliness Code can then be estimated.
A laboratory correlation exercise showed that the ISO code obtained by this comparator method and an ISO code obtained using a standard portable particle counter were within one ISO code number.
Likewise, a visual examination of a particle’s morphology - its shape, size, color, and other details - can also be used, like conventional ferrography, to help elucidate the source of any particles observed.
Oftentimes, the patch test can add a piece of the puzzle missed by other on-site instruments or laboratory analysis. The following examples highlight some cases where patch microscopy was used to help determine a serious mechanical problem that might otherwise have gone unnoticed.
Case Studies Provide Proof of Patch Test’s Usefulness
Example #1
In a high-pressure hydraulic system, the operator suspected that the axial flow piston pump had suffered damage and was operating with reduced efficiency. The laboratory analysis suggested that the system was satisfactory, with no evidence of iron, copper, zinc, or tin, and its 16/13 ISO code was within the target cleanliness level for that system.
A routine patch test (1 µm) showed the presence of numerous brass/bronze cutting wear particles (Figure 1). A subsequent examination of the piston pump revealed severe wear on the slipper pad/swash plate surfaces.

Figure 1. Example #1 Patch Test Result
Example #2
A sample of hydraulic oil from a pre-feeder is detailed in Figure 2.

Figure 2. Example #2 Patch Test Result
The spectrographic analysis failed to detect any abnormal wear or contamination. However, in this case, the PQ index and particle counts showed an abnormal contamination level. Spectrometry failed to detect iron due to the analysis limitation of particle size (less than 5 µm).
The patch test, however, showed a high concentration of spherical particles ranging in size from 20 µm to 75 µm - typical of welding debris (Figure 3).

Figure 3. Example #2 Laboratory Analysis Results
Maintenance was carried out in the vicinity of this unit with no protection. Welding and grinding debris from the environment had entered the unit’s hydraulic system through an inadequate reservoir breather.

Figure 4. Example #3 Laboratory Analysis Results
Example #3
The analysis in Figure 4 was of a sample of hydraulic oil from a prefeeder similar to the unit detailed in Example #2. The spectrographic analysis, particle counting, and PQ index failed to detect any abnormal wear or contamination.
Although the viscosity of the hydraulic fluid was lower than the specification, there was no obvious problem. The patch test, however, revealed possible filter element deterioration (Figure 5).

Figure 5. Example #3
Patch Test Result
Fibers were prevalent over the whole patch surface. A faulty element that had collapsed was subsequently changed.
Example #4
The sample in this example was taken from a production water booster pump at an on-shore oil pumping facility. This example shows the limitations of the spectrographic analysis and also, in this case, the limitation of the PQ analyzer (Figure 6).

The large bronze-type particles greater than 100 µm (Figure 7) were not detected by the emission spectrometer or the PQ instrument, which measures the ferromagnetic debris in the sample. It is important to note that the bronze forces a negative PQ measurement in relation to the positive ferrous reading.

Figure 7. Example #4 Patch Test Result
Example #5
The patch shows debris deposited onto a 3 µm patch (Figure 8). The sample was a 320 cSt gear oil from a reduction gearbox. The bronze particles shown are typical of this type of application. The particle size, shape, morphology and number are indicative of the severity of wear.

Figure 8. Example #5 Patch Test Result
Preparing a Filter Patch for Particle Contamination Detection
Supplies Required for the Test:
- Patch-making funnel
- Oil sampling vacuum pump
- 25 mm filter disc
- Tweezers
- Filtered mineral spirits or reagent-grade kerosene (other solvents may be suitable too)
- 100 X or better microscope
Patch Preparation Procedure
-
Insert the patch-making funnel into the top of the vacuum pump. Tighten the seal by tightening the knurled fitting.

-
Remove the funnel from the white base by turning it counterclockwise.

-
Using tweezers, carefully place a 25 mm filter disc onto the screened surface of the funnel’s interior. Return the funnel to the white base.

-
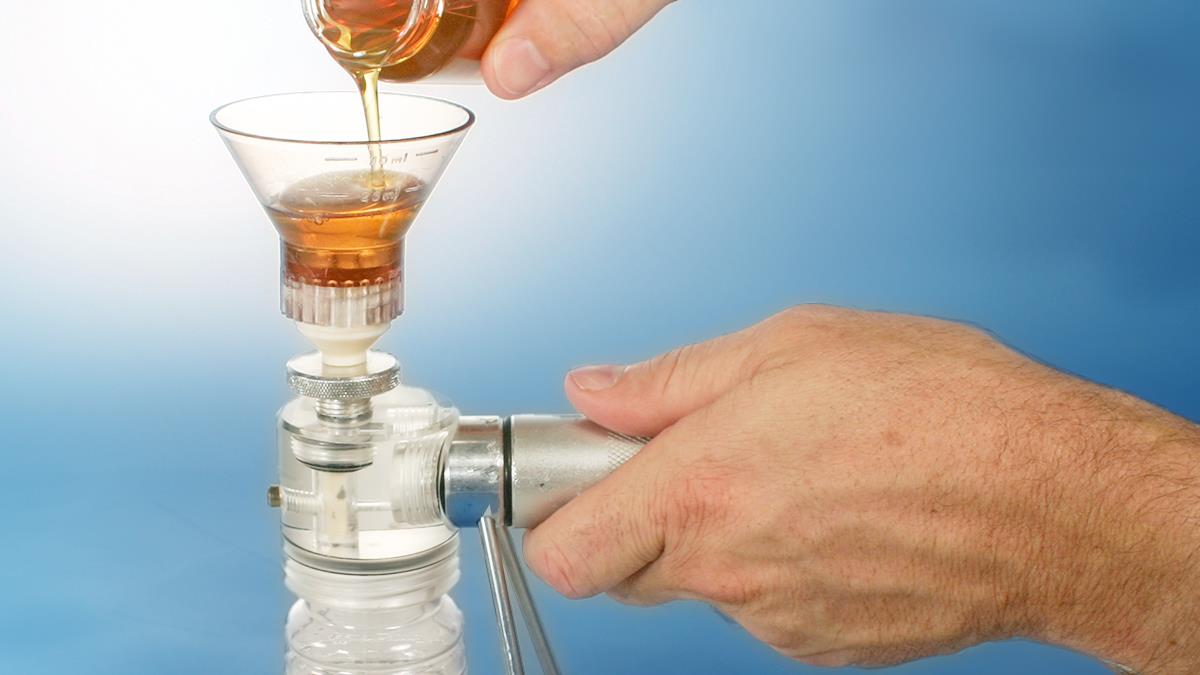
After aggressively agitating the sample, pour the oil into the funnel precisely to the 25 mL mark.

-
Fill the funnel to the 50 mL mark with mineral spirits dispensed through a filter installed on the bottle.*

-
Draw the diluted sample through the filter by activating the vacuum pump until the funnel is empty.

-
Fill the funnel to the 25 mL mark with mineral spirits dispensed through a filter installed on the bottle.*

-
Draw the mineral spirits through the filter by activating the vacuum pump until the funnel is empty.

-
Using the tweezers, remove the patch and place it on a clean surface to dry for 10 minutes.

* Note: Unless you are certain that the mineral spirits and the bottle are free of contaminants, it is highly recommended that the mineral spirits be dispensed through a filter installed on the bottle (not pictured here).
Conclusion
The ability to detect and analyze large particles of different materials, both metallic and nonmetallic, is vital to the success of any oil analysis program. Whether performed in a lab, as most of these examples were, or in the field, on-site patch microscopy can offer some distinct advantages over off-site conventional oil analysis instruments and tests and is an excellent addition to any oil analysis program.
