KPIs for Measuring Lubrication Program Success
Tags: lubrication programs
“What gets measured gets managed” is a popular quote from business guru Peter Drucker.
While it may seem obvious that key performance indicators (KPIs) or metrics play an important role in the success of a lubrication program—what is not as apparent is defining the best metrics for assessing the program’s current status and guiding it to the desired level.
This article will explain how to select the right KPIs and implement them effectively.
One approach for developing a system of metrics is to visualize the program from a high-level perspective. What are the program’s goals? They should be stated as specifically as possible and include a time frame for completion.
Examples would be to improve the lubrication assessment score by 30 points within two years, to reduce bearing failure rates by “X” percent in three years, to implement oil analysis for 100 percent of the critical machines by the end of the year, or to install a new lube room in 12 months.
Some of these examples are more specific than others, but they all refer to relevant program initiatives. General objectives typically will be complemented with more explicit targets.
Setting a time frame will be essential to ensure program accountability. The time should be realistic based on the available resources but also challenging in order to achieve the expected results in a reasonable period.
An effective system of metrics will monitor whether the program’s goals are attained (implementation KPIs) and maintained (continuous KPIs). These types of metrics can identify areas that are performing well, others that require attention and those that will be helpful for estimating the benefits of the chosen strategy.
Temporary vs. Permanent KPIs
Temporary KPIs refer to transition or implementation periods. They should be used while the project or any changes relating to the transitory goals are ongoing. Examples of these types of goals and KPIs are shown in the table below.
The chart below highlights an implementation metric used as an indicator for monitoring and reporting the success of a lubrication program.
Permanent KPIs report or monitor processes, tasks, routines or conditions that have already been implemented and are expected to be in place for a long time. Most of the metrics discussed in this article would be considered permanent KPIs.

Temporary Goals and KPIs
General vs. Specific KPIs
It is possible to have more than one KPI for each goal. In addition, just as specific goals may be part of a more general goal, general KPIs can be a combination of more specific metrics. See the examples in the table below.
Macro vs. Micro KPIs
Macro and micro KPIs are a variation of general and specific KPIs. A micro KPI may be categorized by machine, individual, task, etc. On the other hand, a macro KPI could be a summary of various micro indicators condensed into a general metric.
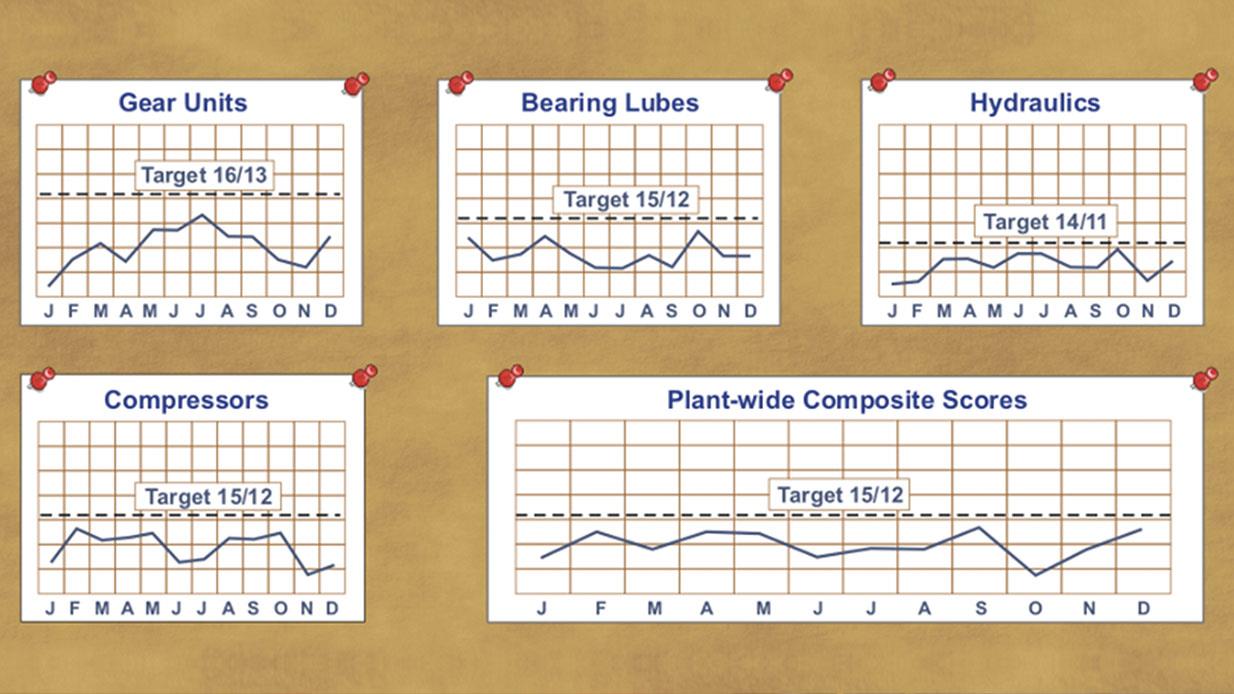
An example of a micro indicator would be to determine if the contamination level of particles in a hydraulic system is within the target range. The answer or indicator is simply “yes” or “no.” The macro indicator would be the total percentage of hydraulic systems with a cleanliness level compliant with the target.
An even more general KPI would be the overall percentage of machines, including compressors, gearboxes, etc., that complied with the cleanliness level. See the illustration above for how general KPIs can be represented.
Leading vs. Lagging KPIs
Lagging indicators monitor events that happen as a result of a process or sequence of actions. They may trigger a corrective action or reactive maintenance. Examples of these types of KPIs would be the number of oil analysis reports with abnormal conditions, the number of individuals requiring specific training, the percentage of machines with abnormal vibration, etc.
Leading indicators are focused to anticipate potential failures or “non-conformities” and alert when action should be taken. These KPIs may report oil analysis results of the incoming lubricant, failure modes and effects analysis (FMEA) of new machines to be installed, oil analysis information on an oil’s varnish potential, etc. The table below includes a combination of macro/micro and leading/lagging indicators.

General vs. Specific KPIs
Lubricant Life Cycle Metrics
For a complete report on the lubrication program’s status or progress, a comprehensive system of KPIs will be necessary to monitor the different elements.
A good approach is to consider the lubricant life cycle within the facility, including lubricant selection, reception and storage, handling and application, contamination control, lubricant analysis, disposal and safety requirements.
Lubricant Selection
This comprises the strategy and actions performed for the selection of the lubricant, the definition of its specifications and performance, identification and purchase processes, as well as the supplier assessment.
Examples of these metrics would include lubricant quality compliance at reception, implementation of the lubricant identification system (LIS) and lubricant specifications, compliance of the technical services versus the goals, and measuring the number of individuals with a Machine Lubrication Technician (MLT) certification who participate in the product decisions.
Reception and Storage

The OilSafe Bulk Storage System is designed to keep lubricants clean, cool, and dry.
These involve the procedures and tasks related to lubricant reception control, stock rotation and storage conditions. Reception and storage KPIs should focus on compliance of the quality-control program and training plan for personnel, as well as supplier performance in regard to work plans, timely delivery of lubricants and LIS code implementation.
Examples of these metrics would include the lubricant’s quality-control results at reception, completion of lube room improvements and the number of safety incidents (misses and near misses) resulting from lubrication practices. Performance indicators will enable periodic measurement to identify areas of improvement and help achieve the key elements of lubricant reception and storage.

Handling and Application
Lubricant handling and application may be the most extensive elements in the system, since they encompass all planning activities, such as routes and PMs, as well as lubricant transfer and administration tasks within the in-service machines.
These KPIs should be centered on the lubrication program’s effectiveness. Some examples would include compliance of the lubrication and inspection routes in a timely manner, unavailability and lost production hours related to lubrication tasks, compliance of the lube technicians and operators with the training and certification plans, overall filter consumption by type, and the number of abnormal conditions detected by lubrication inspections.
Contamination Control

Air Sentry desiccant breathers effectively reduce particulate and moisture contamination
KPIs for contamination control are among the most important metrics for lubrication excellence. They should be focused on the strategy implemented to keep contaminants away from the in-service lubricant.
Examples of these KPIs would be the cleanliness target compliance by machine type, the humidity limit compliance by machine type, the temperature limit compliance by machine type, the compliance of varnish potential limits by machine type, and the progress in the implementation of machine modifications such as desiccant breathers to control contamination levels in the in-service oil.

Macro/Micro and Leading/Lagging Indicators
Lubricant Analysis
Lubricant analysis KPIs help to identify the effectiveness of condition monitoring tasks. These metrics are related to the management of the oil analysis program and the lab’s delivery time. Indicators associated with the program’s implementation must also be employed, such as measuring the progress in the installation of sampling ports.
These types of temporary KPIs can be removed once the implementation stage is completed. Other examples would include the laboratory turnaround time, sample-to-report cycle time, percentage of abnormal results in the oil analysis program, and the ratio of certified engineers and technicians versus the total number of engineers and technicians.
Lubricant Disposal, Leaks and Spill Management
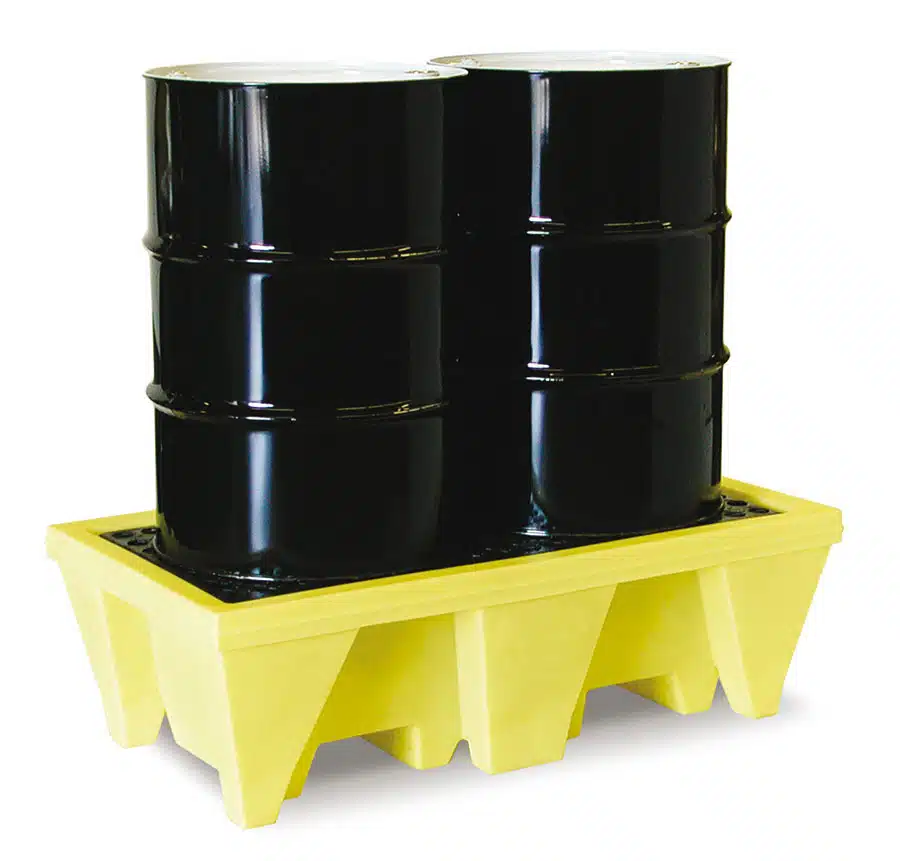
OilSafe Spill Pallets are designed to improve workplace safety and eliminate incidental spills.
These metrics refer to all the procedures used to ensure proper disposal of lubricants and contaminated materials. They may also focus on lubricant spill and leak management.
Examples would include the percentage of lubricants disposed of relative to the number of lubricants purchased, the amount of lubricant-contaminated materials disposed of, the consumption of spill-containment material, the volume or cost of lubricant leaks, and compliance with the ecological disposal training plan.
Implementation Tips
When implementing KPIs, be sure to set goals according to your program’s current conditions. Do not wait until you have a world-class lubrication program to begin monitoring. The goals may be permanent or temporary, but they should be relevant to your program.
Start with a few indicators that you can measure with reasonable confidence and consistency, and then expand as the program progresses. Set responsibilities for the KPIs across your organization and consistently communicate these metrics to your team to create credibility and confidence.
All indicators should also be reviewed periodically. When a metric is not adding value or the results are inconsistent, it may be necessary to redefine or replace it.
KPIs are critical for monitoring the status of your lubrication program. They will enable you to take corrective actions and define improvement strategies. Consider using them to help you make better decisions that can lead to a more successful program.