


Electron microscopy is a valuable research tool that can be used in a number of applications. It was discovered in the 1920s that electrons moving in a vacuum travel in a straight line like light, but have wavelengths 100,000 times smaller.
Around the same time, it was also observed that magnetic fields have effects on electrons similar to the effect glass lenses have on light. Electron microscopes were developed in the 1930s based on the concept of using an electron beam rather than light to examine objects on a very fine scale.
The advantage of electron microscopy is that it can magnify an object 1,000,000 times, down to three to 10 angstroms (1 angstrom is 1x10⁻⁷ mm). It can also incorporate an elemental spectrometer called an energy dispersive spectrometer (EDS).
There are two types of electron microscopes. The transmission electron microscope (TEM) passes an electron beam directly through the sample. Those electrons transmitted through the sample then produce an image on a screen.
The other configuration is a scanning electron microscope (SEM) which uses the electrons to scatter or reflect off the sample to produce its image. In both instruments, EDS uses the X-rays that are emitted from the sample to determine the elemental composition of the sample.

Figure 1. Quanta ESEM 600
Courtesy of FEI Company
Transmission Electron Microscope
In both the TEM and SEM, an electron “gun” beams electrons down a vacuum column. The gun is usually made of a tungsten or lanthanum hexaboride material, which is superheated by an electric current to as much as 2,700°C. Magnetic coils, rather than glass lenses as used in a light microscope, are tuned to focus the electron beam.
In the TEM specifically, the electrons pass directly through the sample before hitting a fluorescent screen which displays the final image. Because electrons are several orders of magnitude smaller than light, it is easy to stop or deflect them. For this to be successful, two things must occur.
First the sample must be thin enough for the electrons to pass through, typically 0.5 micron thick or less. This requires special sample preparation. It also requires a large amount of voltage (between 100,000 and 300,000 volts).
Scanning Electron Microscope
There are a few distinct differences in the way SEM and TEM instruments operate. First, with SEM, the electrons bounce off the surface of the sample (rather than going through the sample) and are then collected on a screen. Second, the instrument is set up so that the electron beam does not bombard the sample in a single beam.
Instead, by modifying an electromagnetic lens, it scans the surface of the sample one line at a time. Finally, because the electrons are not passing through the sample, there are a couple of advantages: sample size is limited only by the instrument’s compartment and less voltage is required.
A typical voltage in an SEM ranges from 200 to 30,000 volts. Figure 2 compares the elements of the light (optical) microscope with the TEM. Figure 3 shows a functional diagram of a SEM.

Figure 2. Comparison of an Optical (left) to a
Transmission Electron Microscope (right)
Courtesy of FEI Company
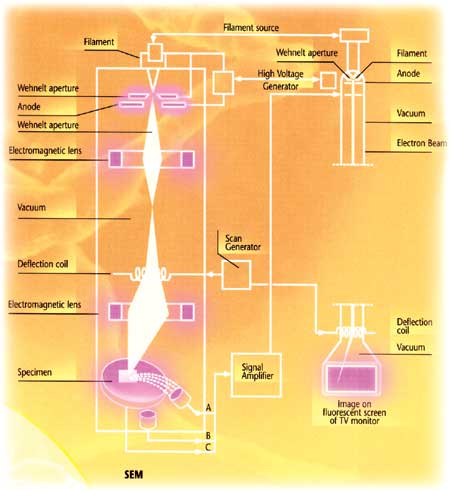
Figure 3. A Scanning Electron Microscope (SEM)
Courtesy of FEI Company
Advantages of Both Instruments
Because of the differences in the way TEM and SEM work, each has its own distinct advantages (Figure 2). With TEM, for instance, it is able to view a sample at a magnification approximately 10 times that of an SEM (objects as small as three to 10 angstroms for TEM).
Also, because of its ability to transmit through samples, it can not only characterize particle surfaces, but it can also reveal the sample’s internal structure. For instance, two spherical particles, one solid and one hollow, would show up with different reflected images as shown in Figure 4.
The solid particle would show up darkest at the center, because that is where the most material is, and would fade out in a radial direction. Conversely, the hollow particle would look darkest at the edges and would fade gradually toward the center.

Figure 4
One advantage of SEM is that it provides a better overall visual image of the sample. This is because as it scans over a sample line by line, it gives the image a depth of field, almost making the object three-dimensional. In a TEM image, no depth of field can be seen on the image.
Another advantage of SEM is that it is more flexible in the type of samples it can view because the sample does not need to be nearly as thin as with TEM. Therefore, SEM can analyze samples such as larger wear debris particles and distressed machine surfaces.

Figure 5. Soot Analyed Under TEM
500,000x (see reference #5)

Figure 6. Soot Analyed Under SEM
15,000x (see reference #4)
Applications
While both tools are sufficient in some cases, there are instances when one instrument may be more useful than another. For instance, both instruments are able to scan soot, however, TEM appears to be the more commonly used research instrument in this application.
This is likely because of its ability to analyze the internal structure, not only in ways described earlier, but also providing the elemental constituents of the entire particle structure, not just the surface.
With SEM, a surface examination of a failed gear or bearing is more suitable. As mentioned, the sample does not need to be thin, which might damage the evidence present on the sample. And, the 3-D image provides better visual definition to better characterize the type of wear (abrasion, adhesion, etc).
For more information on EDS capabilities in electron microscopes and more on SEM features, you can read Applying SEM-EDS to Practical Tribology Problems by Bill Herguth and Guy Nadeau.
References
- FEI Company brochure. “All You Wanted to Know about Electron Microscopy but Didn’t Dare to Ask,” 2002.
- http://cryoem.berkeley.edu retrieved Oct. 4, 2004, last revised March 24, 2004.
- Song, J., M. Alam, A.L. Boehman and K. Miller. “Characterization of Diesel and Biodiesel Soot.” In ACS Fuel Chemistry Division Preprints, 49(2), p. 767-769, 2004.
- Vittal, M., J.A. Borek, D.A. Marks, A.L. Boehman, D.A. Okrent and A.P. Bentz. “The Effects of Thermal Barrier Coatings on Diesel Engines Emissions.” ASME Journal of Engineering for Gas Turbines and Power. p. 121, 218-225, 1999.
